Wastewater Visibility News
What Is Your Wastewater Tank Capacity?
The following article by Denver J. Stutler, Jr., P.E., was published in Volume 44, No.1, Spring 2023 of The Wave, the official magazine of Alabama’s Water Environment Association, and is reshared here with the Association’s permission.
Alabama’s Water Environment Association (AWEA) is a not-for-profit, educational, and technical organization that has been dedicated to preserving, protecting, and managing Alabama’s waters since 1977. AWEA is a state-wide affiliate organization of the Water Environment Federation (WEF).
What Is Your Capacity: Visibility in Wastewater Tanks Helps Utility Managers
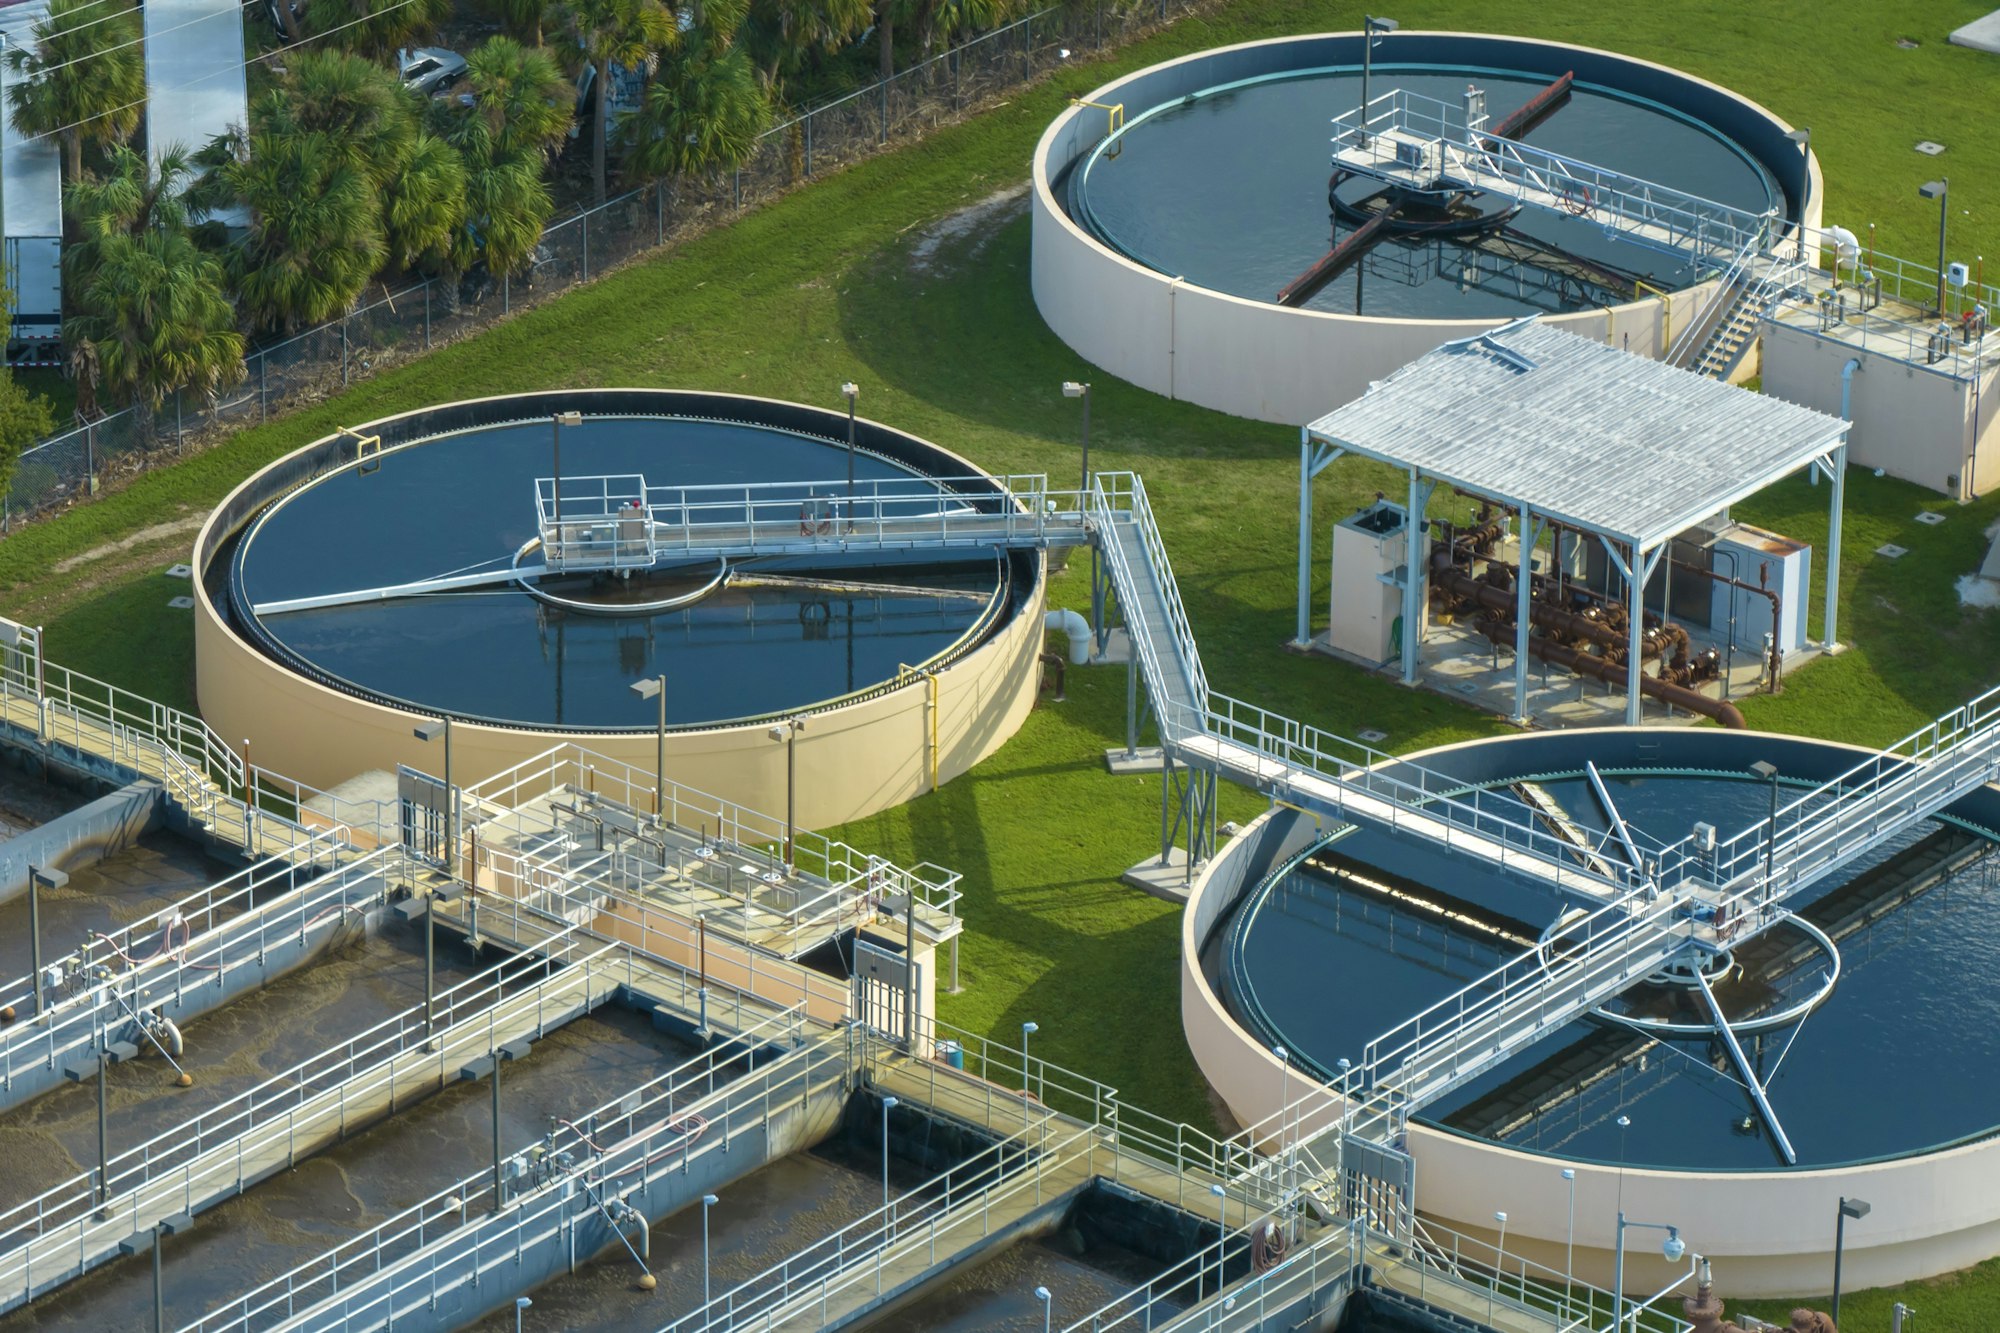
Today’s utility operators and wastewater engineers recognize adequate wastewater tank capacity as a key component of treating wastewater to the standards intended and prescribed by law. But as sand, grit, sludge and other solids enter wastewater tanks, the volume essential for treating wastewater is displaced, and critical capacity is reduced.
Reduction in volume results in decreased wastewater detention time in tanks. With diminished exposure to the treatment protocols of each tank, the wastewater treatment process becomes increasingly less effective. Sand, grit and other sediments accumulate in tanks translating to increased use of chemicals, greater electricity consumption and undue wear and tear on equipment.
Assessing What You Cannot See
Wastewater facility operators and managers rely on visual clues to help them assess many conditions within their plant. Rust and visible exterior cracks signal the need for tank and equipment repair. Overgrown vegetation says it’s time to trim. And chemical supplies on hand can be tracked visually or via inventory management software. The ability to see and visibly assess these situations makes prioritizing and scheduling maintenance and repair tasks, if not easy, at least relatively straightforward.
But how do operators and managers deal with conditions they cannot visually assess? The inability to see more than a few inches below the surface of dark water within an aeration basin or similar tank plagues operators who must attempt to incorporate tank/treatment capacity into their Asset Condition Assessments or Predictive Maintenance Plans.
Capacity Assessment and Predictive Maintenance
Unable to see how much capacity has been lost to sediment accumulation, managers and operators generally rely on more rudimentary techniques to inform their tank maintenance planning. Manually probing with a survey rod, dispatching divers or extrapolating projections based on historical data are traditional techniques for estimating tank capacity.
In the end, probing is limited to reach, diving is dangerous and the results of either include degrees of speculation. Even draining a tank leaves operators guessing about the volume of residual sediment and may require extensive time to bring the tank back online and into operation.
Maintaining optimal tank capacity and managing budgeted funding effectively is an ongoing balancing act for most operators. The challenge gives rise to some very real and tough-to-answer questions: What if I choose not to clean my tank, but it’s loaded with sediment, driving operating expenses up and performance down? What if I allocate funds for cleaning, but sediment is minimal, and I’ve wasted funds I needed elsewhere? Or, what if there’s more sediment than expected, and I must deal with the added expense and the time lost to a change order?
The Capacity Conundrum
The following three case studies show outcomes for utility operators who elected to use SediVision® to help them resolve their tank capacity conundrum, that difficult-to-achieve balance of wastewater tank capacity and operational resources. In each situation, the operator’s goal was to maintain the facility proactively, strategically managing maintenance and operational funding.
SediVision’s proprietary technology is a relative newcomer to the wastewater industry. Eliminating divers, probes and the need for draining tanks, SediVision utilizes a proprietary regimen of onsite field data collection that is then processed through a proprietary sequence of data synthesis. The result is advanced technology mapping of dark water. Upon the completion of the SediVision data collection and mapping process, wastewater managers or operators are equipped with a high-quality image of the location and quantity of sediment accumulation within their tanks.
Case Study 1: A Southwest Florida 5 MGD Wastewater Treatment Plant
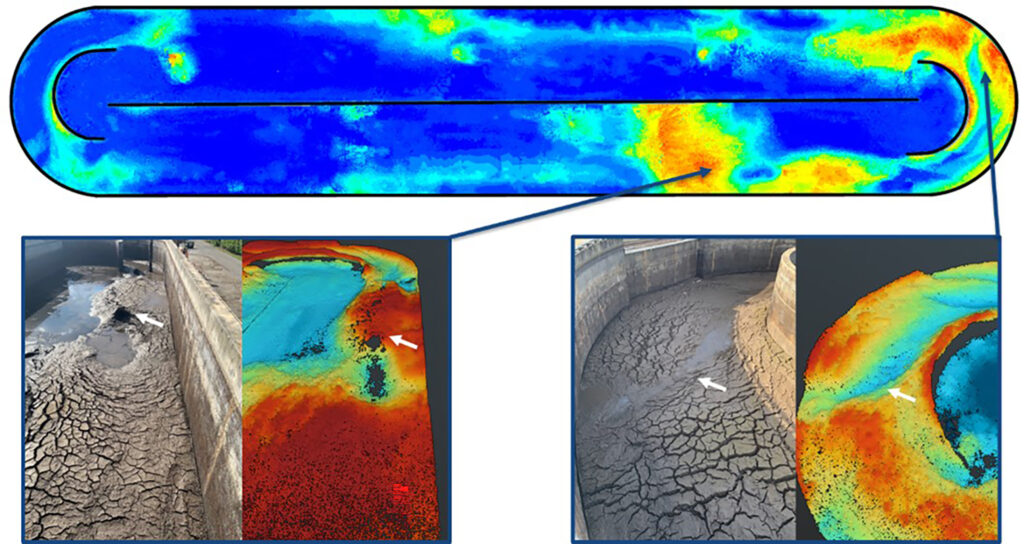
A southwest Florida utility includes two matching 80 ft. x 440 ft. oxidation ditches. The east oxidation ditch was cleaned a few years prior. The cleaning involved a complete drain down, and there was uncertainty regarding how much material would need to be removed.
In 2022, the facility prepared to drain and clean the west oxidation ditch. Multiple hurricanes had already strained the utilities’ operating budget. To support its decision-making, the utility chose to invest in data by deploying SediVision to help its team more accurately access the degree and scope of the situation.
The SediVision assessment revealed a volume of over 1700 CU Yds. of sediment throughout the ditch and pinpointed its location. The assessment confirmed the need to clean the tank, as it was operating at a 12 percent loss of capacity, with a 10 percent loss of capacity being the industry standard to signal the imminent need for maintenance.

Equipped with reliable data regarding the scope and location of the material, the project moved forward. The SediVision data was also useful to the cleaning contractor for estimating the project duration and anticipating the materials needed to complete the project.
When the tank was drained, the topography of the sediment aligned with the SediVision data, leaving little to no surprises to the owner or contractor. Between the time of the SediVision assessment and the cleaning, the plant was in the path of Hurricane Ian, which may have introduced additional material into the system. During the cleaning process, the material in situ could not be dewatered to completion. As a result, the material hauled offsite contained some portion of water. Despite this issue, the amount of material estimated by SediVision was within 16 percent of the total amount removed.
Case Study 2: A Central Florida, 2 MGD Wastewater Treatment Plant
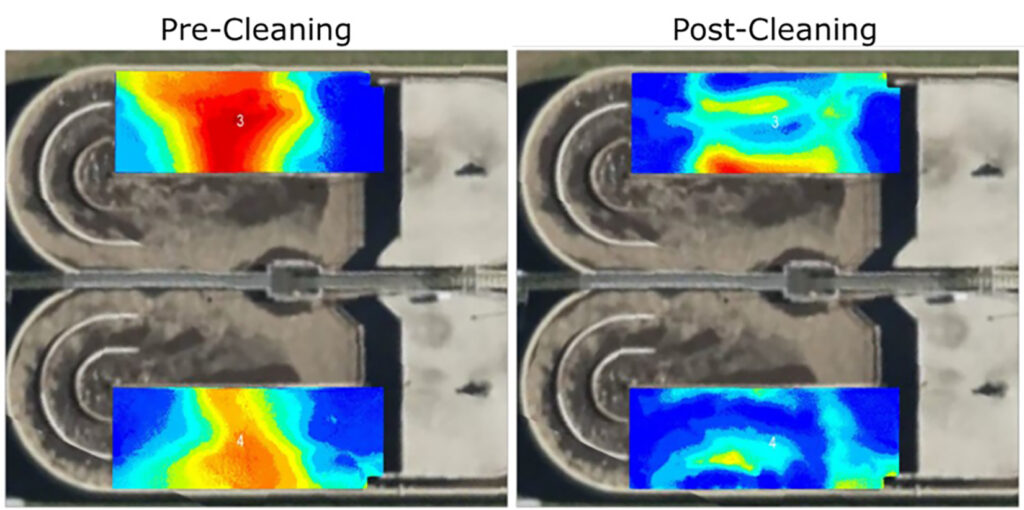
A utility in central Florida has a wastewater treatment plant with two 50 ft. x 200 ft. oxidation ditches that were scheduled to be cleaned. Initially, the oxidation ditches were probed with a surveying rod in areas accessible by a catwalk. However, drawing conclusions about the amount and distribution of the material was challenging because of the limited information probing provides.
The utility sought to contract a company to clean the tanks while in full operation. SediVision technology was chosen to help determine the scope and budget of the project.
The owner utilized online cleaning based on the location, quantity and type of material and avoided draining the tank. SediVision data helped the contractor guide its cleaning equipment. Upon completion, a post-SediVision assessment verified the cleaning efforts by removing 185.27 tons of material.
SediVision assessment results showed 6.5 ft. mounds of material in tank areas not accessible to probe. This case study highlights how much information about the material in the tank may be missed when using traditional probing.

Case Study 3: A Southwest Alabama 4 MGD Wastewater Treatment Plant
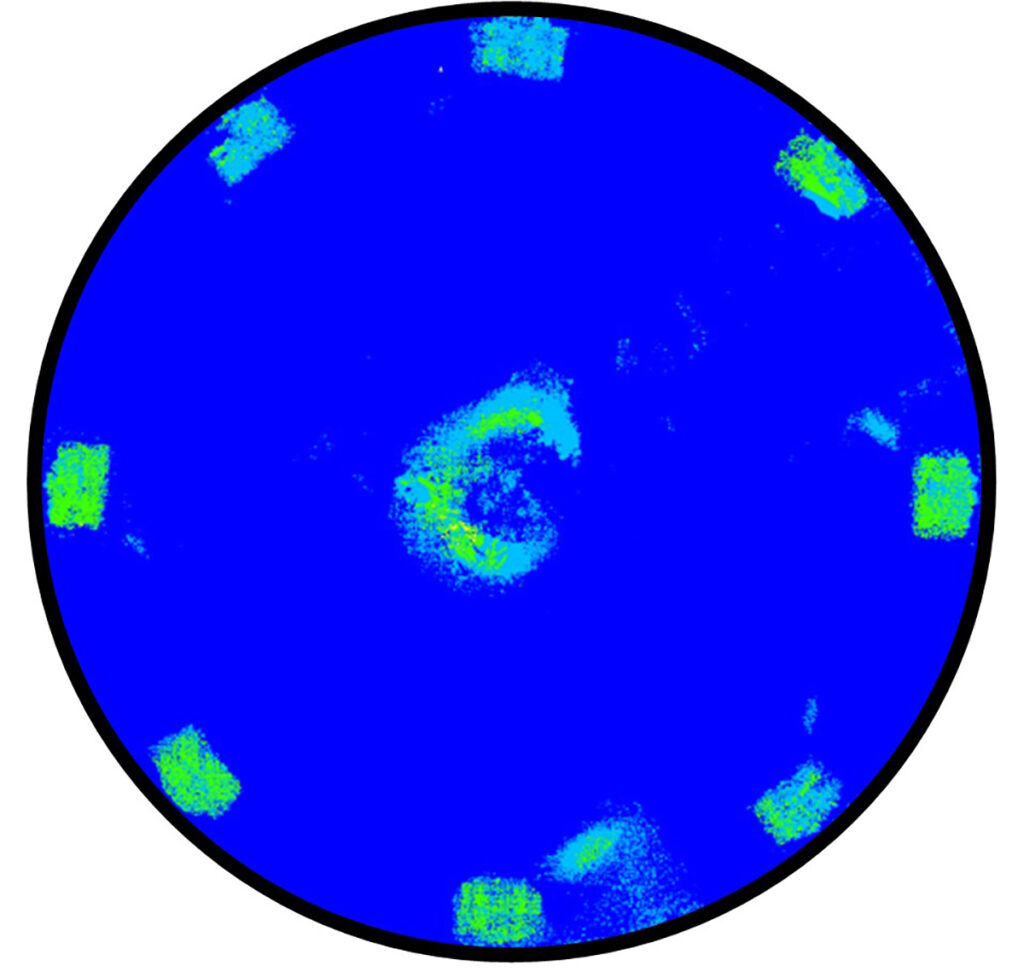
A utility in Alabama has a 140 ft. diameter aeration tank that it believed needed cleaning. Roughly a quarter million dollars was budgeted for the anticipated cleaning. To the utility operator’s surprise, little to no material was discovered during the SediVision assessment.

These results led to the owner’s peace of mind and the redeployment of limited resources to support other projects. Because cleaning was not required, the utility could spend the funds allocated for tank cleaning on its next-highest priority project.
The Water Reclamation Facility Supervisor, Sharon Surra, at the Daphne, Alabama plant explained, “Our grit removal system was frequently down, allowing grit introduction in the treatment trains. Our largest treatment train had been in service for decades without draining and cleaning because it could not be taken out of service.
“The smaller train was drained and cleaned annually, and large amounts of grit were removed each time. We weren’t sure how much grit might be in the larger train, so we set a worst-case budget of $225,000 to clean this system. SediVision offered a service that assesses the quantity of grit in an in-service tank, so we hired them to evaluate it. Their evaluation showed no significant grit accumulation in this aeration basin, saving us $225,000 in this year’s budget.”
Observations and Takeaways
SediVision is a predictive maintenance solution developed to deliver reliable and specific information regarding the volume and location of debris material accumulated in wastewater tanks. These insights provide wastewater utility operators, managers and wastewater engineers with informed data for assessing tank capacity and conditions. And the case studies in this article and other data not included here demonstrate the value of this technology in supporting strategic decision-making and allocation of resources.
Expanding beyond the maxim that a picture is worth 1,000 words is the firsthand insight provided by a utility operator, who, after seeing the SediVision assessment of his facility, described the tool as being “like an MRI for wastewater tanks.”
For additional case studies and information, go to sedivision.com or contact (866) 982-6531.

Author Notes
Wastewater Visibility News
Tags:
More Recent Posts

First-Ever National Drinking Water Standard to Protect 100M People from PFAS Pollution

Are Your Wastewater Tanks Consuming Excess Energy Due to Sand and Grit? Emerging Technology Can Help You Find Out

Happy Easter

Efficiency in Serving Wastewater Utilities
Subscribe
Get news delivered straight to your inbox the day it gets published."*" indicates required fields

